
Oakland Speed Cameras Reduce Major Speeding Violations by 70%


Oakland’s automated speed cameras reduced excessive speeding by an average of 70% across 18 locations, according to a city progress report released Aug. 20. The cameras issued nearly 200,000 citations during their initial enforcement period, with more than half sent to addresses outside Oakland.
Key Takeaways:
- Oakland reported an average 70% reduction in vehicles traveling at least 11 mph over the speed limit across 18 camera locations.
- The Seventh Street corridor recorded the largest reduction, with speeding falling 91%.
- The cameras issued nearly 200,000 citations during the first four months of enforcement.
- More than half of the citations were mailed to addresses outside Oakland.
- Oakland’s speed-camera pilot began issuing citations March 15 after a two-month warning period.
Oakland Reports 70% Reduction in Excessive Speeding
Oakland speed cameras reduced the number of vehicles traveling at least 11 mph over the posted speed limit by an average of 70% across 18 locations, according to a progress report released by the city’s Department of Transportation on Aug. 20. The cameras are located within Oakland’s high-injury network, and the reported reduction was measured against speed data collected before the cameras were installed.
The city’s data covers the initial enforcement period after the cameras began issuing citations on March 15. Before enforcement began, Oakland used a two-month warning period that started Jan. 14.
The largest reduction occurred on Seventh Street between Adeline and Linden streets. The city reported a 91% decline in vehicles traveling at least 11 mph above the speed limit at that location.
The 18 camera locations are part of Oakland’s pilot for automated speed enforcement. The pilot operates under a 2023 California law that authorized Oakland and five other cities to use the technology for five years.
The law also authorized speed-camera pilots in San Francisco, San Jose, Long Beach, Los Angeles and Glendale. Oakland’s results therefore provide data from one of several California cities testing automated enforcement under the same state authorization.
The city’s traffic-safety approach is part of a wider Bay Area transportation system that also includes regional rail and other forms of public transit.
Speed Cameras Issued Nearly 200,000 Citations
Oakland’s cameras issued nearly 200,000 citations during the first four months in which they were issuing penalties, according to the city’s progress report. The citation total covers vehicles recorded at the camera locations after the warning period ended.
The city’s report also found that speeding violations represented a small share of the vehicles passing the cameras. Across all camera locations, approximately 1.5% of vehicles received violations, meaning the large majority of vehicles were traveling close to the posted speed limits.
The enforcement system applies to vehicles traveling at least 11 mph above the speed limit. Under California law, automated speeding cameras issue a $50 citation at that threshold, with the fine increasing as the recorded speed rises.
The maximum citation is $500 for a driver traveling more than 100 mph over the speed limit. The penalties issued through the automated system are civil penalties rather than criminal charges.
California law also prevents the camera citations from being used to revoke or suspend a driver’s license. The system is therefore designed to impose a civil financial penalty for qualifying speeding violations rather than create a driver’s-license sanction.
Oakland’s citation volume is also higher than the number issued by San Francisco during the comparable early period described in the city’s reporting. The difference comes as both cities operate automated speed-enforcement systems under the California pilot law.
The use of automated technology is also appearing in other Bay Area transportation systems. BART, for example, has tested AI-equipped fare gates at selected stations as part of efforts to address fare evasion.
Seventh Street Records Largest Speeding Decline
Seventh Street between Adeline and Linden streets recorded a 91% reduction in vehicles traveling at least 11 mph over the speed limit, according to Oakland’s data. It was the largest reduction among the 18 camera locations included in the report.
The cameras are positioned on streets included in Oakland’s high-injury network. The network identifies locations where traffic injuries are a particular concern, making those corridors the focus of the city’s automated enforcement pilot.
Oakland Department of Transportation Director Josh Rowan said the results showed substantial changes in speeding within a relatively short period. He also said the city’s streets can contribute to higher vehicle speeds because some local roads are wide, straight and designed to accommodate fast-moving traffic.
Rowan identified Oakland’s role as a route between destinations as another factor in the traffic patterns observed by the department. The citation data showed that many of the addresses associated with violations were outside Oakland.
The city’s data distinguishes between the number of vehicles receiving violations and the much larger number of vehicles passing the cameras. With violations issued to approximately 1.5% of passing vehicles, most drivers at the monitored locations were not cited.
The reduction at Seventh Street is part of the broader 70% average decrease reported across all 18 camera locations. The figures compare the number of vehicles exceeding the speed threshold before and after the automated enforcement system was installed.
Non-Oakland Addresses Account for Most Citations
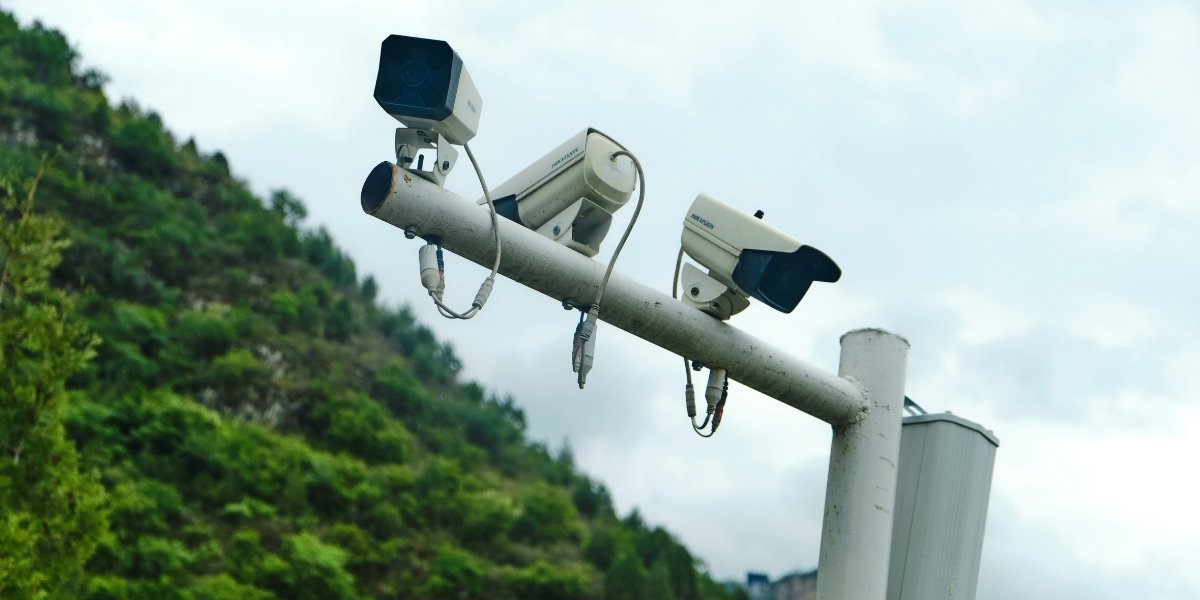
Photo Credit: Unsplash.com
More than half of the nearly 200,000 citations issued during the initial enforcement period were mailed to addresses outside Oakland, according to the city’s progress report.
The address data provides a measure of where registered vehicle owners associated with the citations live. It does not change the reported reduction in speeding at the camera locations, which is based on vehicle-speed data collected by the city.
The finding also accounts for the large number of vehicles traveling through Oakland. Department of Transportation Director Josh Rowan said the city’s streets are used by people traveling between other destinations.
The cameras therefore record vehicles driven by Oakland residents as well as vehicles registered to people who live elsewhere. The citation figures indicate that non-Oakland addresses represented more than half of the penalties during the period covered by the report.
The city reported that speeding drivers remain a small minority of vehicles traveling through the monitored locations. Approximately 1.5% of vehicles passing the cameras received violations across the camera locations combined.
The citation data and speed data measure different aspects of the pilot. Citation totals show the number of penalties issued, while the 70% figure measures the reduction in vehicles traveling at least 11 mph above the posted speed limit.
Oakland’s automated enforcement system began with a warning period rather than immediate citations. From Jan. 14, drivers received warnings before citations began on March 15.
The city’s transportation network also includes ferry service connecting Oakland and other Bay Area communities. Recent fare changes have affected Oakland and Alameda ferry routes as regional transportation agencies adjust service costs and operations.
Citation Rules Under California Law
California’s automated speed-camera law establishes the citation threshold and the civil nature of the penalties. A vehicle traveling at least 11 mph over the speed limit can receive a $50 citation, with higher fines for greater speeds.
The fine can reach $500 when a vehicle is recorded traveling more than 100 mph over the speed limit. Citations from the automated cameras cannot be used to revoke or suspend a driver’s license.
The five-year pilot authorization covers Oakland, San Francisco, San Jose, Long Beach, Los Angeles and Glendale. Oakland’s system is therefore operating under a state framework that permits automated speed enforcement in those six cities.
Oakland Considers Additional Street Safety Measures
Oakland Department of Transportation Director Josh Rowan said the speed-camera results have also prompted discussion about physical changes to city streets. He identified roundabouts as one possible type of long-term safety project.
The discussion is separate from the camera enforcement itself. The cameras are producing automated citations for qualifying speeding violations, while street redesign would change the physical characteristics of the roads.
Rowan said Oakland has streets that are wide, straight and fast and that some were built to standards associated with highways. The city’s transportation department is considering how those physical characteristics affect vehicle speeds and the design of future safety measures.
The reported 70% average reduction applies to the 18 camera locations included in the progress report. The Seventh Street location produced the largest reported decline at 91%.
Oakland’s pilot began issuing citations March 15 after the two-month warning period that started Jan. 14. The first four months of citation activity produced nearly 200,000 penalties, while the six-month progress report also examined changes in vehicle speeds across all 18 locations.
The city’s data shows that the automated enforcement system has been associated with lower rates of vehicles traveling at least 11 mph above the speed limit at the monitored locations. The report also shows that most vehicles passing the cameras were not cited.
Oakland’s approach to street design can also be considered alongside other Bay Area projects that combine pedestrian improvements with changes to road infrastructure. A San Francisco public-art corridor project, for example, includes wider sidewalks, raised crosswalks, lighting and traffic improvements.
Frequently Asked Questions
How much did speeding decrease after Oakland installed speed cameras?
Oakland reported an average 70% reduction in vehicles traveling at least 11 mph over the speed limit across 18 camera locations. The locations are within the city’s high-injury network.
How many citations did Oakland’s speed cameras issue?
The cameras issued nearly 200,000 citations during the first four months of enforcement. More than half of the citations were mailed to addresses outside Oakland.
Which Oakland location recorded the largest drop in speeding?
Seventh Street between Adeline and Linden streets recorded the largest reported reduction. The city said vehicles traveling at least 11 mph over the speed limit fell by 91% at that location.
Why did more than half of Oakland’s speed-camera citations go to nonresidents?
More than half of the citations were mailed to addresses outside Oakland. Oakland transportation officials said the city’s streets are also used by people traveling between other destinations.
How much are Oakland speed-camera citations?
California law sets a $50 citation for vehicles traveling at least 11 mph over the speed limit. The fine increases with higher speeds and can reach $500 for a vehicle traveling more than 100 mph over the speed limit.

